 GeoData.NZ
National Institute of Water and Atmospheric Research (NIWA)
Type of resources
Available actions
Topics
Keywords
Contact for the resource
Provided by
Years
Formats
Update frequencies
status
Resolution
-

The data set contains water temperature, salinity, and oxygen taken by CTD during three hydrographic sections perpendicular to the slope in the Western Ross Sea between Cape Adare and the Drygalski Trough. Data are in NetCDF. RELATED PUBLICATION: https://doi.org/10.1038/s41598-021-81793-5 GET DATA: https://www.ncei.noaa.gov/archive/accession/0219916
-
Ocean acidification conditions around the New Zealand coast are being measured to establish baseline conditions and to quantify future change. The NZOA-ON is a network of coastal sites around the country – a mix of pristine and urban sites, and sites which are of particular interest to regional councils, the aquaculture and fishing industries, and sites of scientific interest. Data will be used to determine local conditions, and to provide a baseline against which to measure future change. This network is linked into the Global Ocean Acidification Observing Network (GOA-ON The network uses existing data collection infrastructure where possible to take advantage of auxiliary data and historic records. Sampling partners collect fortnightly water samples, liaise regarding shipment and logistics, and assist with deployment of the sensors. Sampling partners collecting the water samples, possibly as part of existing monitoring programmes, have access to the data to help them with their own management strategies. Sampling partners include regional councils, the Department of Conservation, and aquaculture industries. Water samples are taken fortnightly at each site (see Figure 1 for the sampling sites) by the sampling partners, then the full crates are returned to Dunedin for analysis of acidity parameters - alkalinity and total dissolved inorganic carbon (to develop a long-term data series). We then calculate pHT, pCO2, carbonate ion concentration, and saturation states. NIWA provides sampling partners with bottles, crates, chemically resistant gloves and training (including health and safety information). The actual sampling isn’t difficult, however sampling partners are required to use a droplet bottle to add a couple of drops of mercuric chloride (which is toxic) into the full sample bottles, so that the seawater is ‘preserved’ until it gets to the lab. SeaFET pH sensors[2] are deployed for 4-5 months at each site, and are moved from site to site to help determine short term variability at each location. Additional parameters are measured at the Dunedin and Firth of Thames sites, so that these sites meet the extra requirements of the Global Ocean Acidification Observing Network (GOA-ON). The network uses data collection infrastructure where possible to take advantage of auxiliary data and historic records.
-

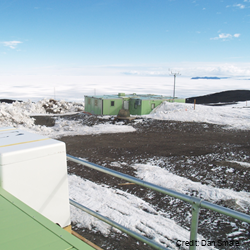
Climate data have been collected at Scott Base continuously since 1957 and more recently from Arrival Heights and is one of the longest continuous climate records in Antarctica. Climate parameters measured include: wind speed and direction, air temperature, relative humidity, barometric pressure, and global, diffuse and direct solar radiation. Climate data are collected on a daily basis from both sites. At Scott Base, this takes two forms: a standard daily observation at 0900 NZDT, and continuous data collection at 10 minute and hourly intervals using a CR10X data logger. The initial record of the 0900 daily observations began on 1 March 1957 with air temperature, air pressure, wind speed and direction, and global solar radiation being measured with standard instrumentation (wind measurements since 1972). This record constitutes the reference record. In January 1997 an electronic weather station (EWS) was added to collect and archive 10 minute and hourly data. The daily manual observations continued so as to provide a continuous reference and daily record. Historically, Arrival Heights only had a wind recorder (since January 1984). A data logger was installed in January 1999 and measured air temperature, relative humidity and global solar radiation using a secondary network sensor, as well as wind speed and direction. A barometric pressure sensor was installed in 2001. A standard 10m mast was installed and all sensors were moved to the new Arrival Heights laboratory in 2007. 10-minute and hourly data are recorded. Data are retrieved and archived from both automatic stations daily, as well as manual observations from Scott Base and available on New Zealand's national climate database. From February 2019, mercury theremometers and barometers were removed from Scott Base and Arrival Heights. Where applicable, these were replaced with electronic instruments. A weighing precipitation gauge was also installed in February 2019 for the measurement of solid precipitation at Scott Base. GET DATA: https://cliflo.niwa.co.nz/
-
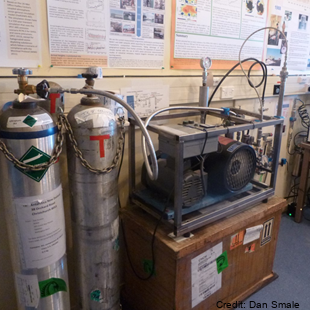
Gas samples (CO2, CH4, CO, N2O, 13CO2, 14CH4, 13CO, C18O, 14CO) are collected from an inlet atop of a mast 5 metres above ground level in North sector wind conditions. Flasks and cylinders are analysed back at NIWA Greta point Gaslab. The sampling was established in November 1989. Samples are only taken when wind is from the Northerly sector and above 5kts. High pressure cylinders: ~1600psi in 30 litre cylinders and low-pressure flask samples taken (~5 litres, 25 psi in 2 litre flask). Air samples in the Cylinders & Flasks shipped to New Zealand regularly. Analysis performed at NIWA's GASLAB located at Greta Point Wellington. Analysis by Gas chromatography (GC) and isotope ratio mass spectrometry (IRMS). A semi-automated flask sampling system was installed in February 2017, allowing extra flask samples with minimal operator intervention. GET DATA: Contact Gordon Brailsford (g.brailsford@niwa.co.nz)
-
Ultraviolet radiation measurements over the spectral region 290-450 nm with a high precision spectro-radiometer. The spectro-radiometer was installed at Arrival Heights as a two month (November 2006 – January 2007) blind inter-comparison with the established measurement programme run by Biospherical Instruments for the USAP. The data was compared with the USAP data taken simultaneously. These data are held internally by NIWA. GET DATA: contact dan.smale@niwa.co.nz
-

This data collection contains water column observations from CTD probes and water bottles deployed by the National Institute of Water and Atmospheric Research (NIWA) and its predecessor, the New Zealand Oceanographic Institute. A variety of instruments where used in this dataset, including: Sea-Bird SBE 911Plus CTD
-

Using seafloor image data to build single-taxon and community distribution models for seabed fauna in New Zealand waters. Understanding the spatial distributions of seabed biodiversity is essential for effective management of the effects of human activities including fishing and mining. To improve understanding of seabed fauna distributions, we are developing a new database of benthic invertebrate occurrences in New Zealand waters by assembling quantitative data from all available seabed photographic surveys. By modelling the spatial relationships between taxon occurrences and environmental gradients across the region, we are able to predict the likelihood of individual taxa and communities being present in as-yet unsampled areas. In the first phase of the project, we concentrated on Chatham Rise; a region of high importance to commercial fisheries and with the highest density of available seabed imagery. Predictions from the models developed here are the first abundance-based models of benthic distributions in the New Zealand region and are the best-informed representations of seabed distributions on Chatham Rise to date, providing a resource that will have applications in marine environmental management and ecosystem research. All rasters are in a geotiff format at a 1000 m resolution cell size and projected to WGS 84 / Mercator 41 - EPSG:3994 coordinate system.
-
This data collection contains observations from CTD sensors attached fisheries trawls deployed by the National Institute of Water and Atmospheric Research (NIWA) and funded by the Ministry of Primary Industries. Data was sourced from SeaBird MircoCAT SBE 37 instruments which were attached to the headlines of trawl nets as part of fisheries research programs. The data is processed using the SBE Data Processing software and only the downcast of the cast is retained (because of the turbulence of the water generated by the trawl gear once the trawl is underway. Measured variables are temperature, depth, and salinity. The sensors on the CTD are all regularly calibrated by the manufacturer, but data are not calibrated in-situ.
-

Gravel percentage of seafloor sediments from the New Zealand region from nzSEABED database. Data or descriptions of gravel content are from the top 10 cm of the seafloor. Gravel is defined by its texture/grainsize (all sediment <2mm) and does not reflect the composition of the seafloor sediment.
-

Using seafloor image data to build single-taxon and community distribution models for seabed fauna in New Zealand waters. Understanding the spatial distributions of seabed biodiversity is essential for effective management of the effects of human activities. However, existing knowledge of seabed faunal distributions comes overwhelmingly from records of museum specimens and fisheries and research trawl bycatch. Data from such sources have been used to build models that predict species and community distributions on the basis of correlations with environmental gradients but because these models are based on presence-only data from disparate sources and times, their predictions are considered uncertain. To improve understanding of seabed fauna distributions around New Zealand, we are developing a new database of occurrences and population densities based entirely on quantitative data from seabed photographic surveys designed to sample these fauna. By modelling the spatial relationships between taxon occurrences and environmental gradients across the region, we are able to predict the likelihood of individual taxa and communities being present in as-yet unsampled areas. In the first phase of the project, we concentrated on Chatham Rise; a region of high importance to commercial fisheries and with the highest density of existing seabed imagery. The models developed here were the first abundance-based models of benthic distributions in the New Zealand region at these spatial scales. In the second phase, we expanded the domain of the predictive models to encompass Campbell Plateau, in the south-eastern sector the EEZ. Combining data from Chatham Rise and Campbell Plateau in a single dataset of benthic invertebrate taxon occurrences and population densities enabled development of up-dated predictive distribution models for a range of individual invertebrate taxa, as well as models of the spatial variability in overall community composition. Rasters are in a geotiff format at a 1000 m resolution cell size and have their relevant projections written in their files.